Note: Reporting can be turned on for individual users, so if you don't see it in the navigation talk to your administrator. They can turn it on for you.
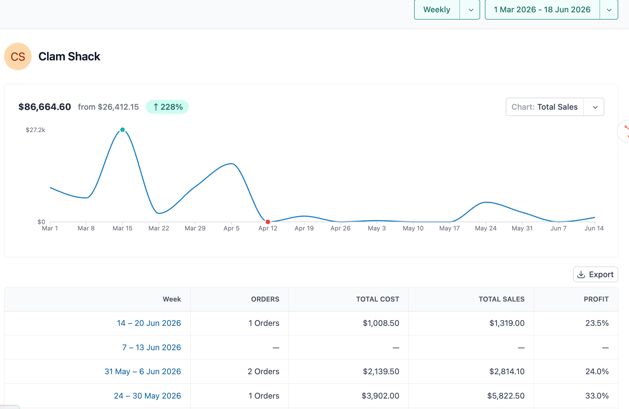
Customer Reports: Answer: "How is this customer doing over time?" — See their total orders, spend, and whether they're buying more or less than before.
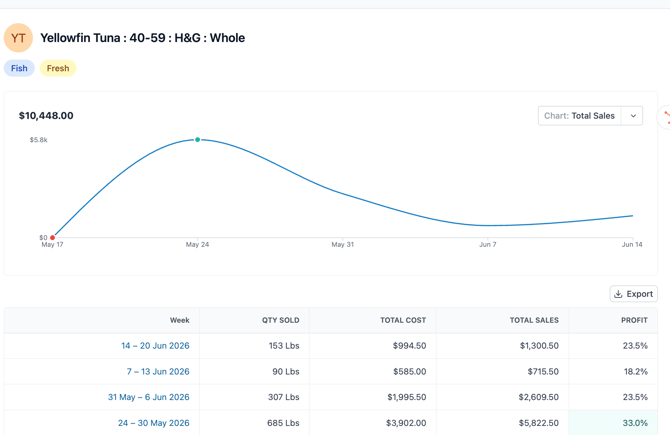
Product Reports: Answer: "How is this item selling?" — See volume in pounds, total revenue, and your profit margin week by week.
How to read these reports:
Orders / Qty sold For customers, this shows the number of orders placed that week. For products, it shows pounds (or other quantity) sold. This tells you activity level at a glance.
Total cost vs. total sales Cost is what you paid for the product. Sales is what your customer paid you. The gap between them is your gross profit.
Profit % This is the most important column. A healthy seafood margin is typically 20–35%. Watch this number week over week — if it drops, your cost went up or your price didn't keep pace.
Use the dropdowns in the top-right corner to switch between weekly and other views, or pick a custom date range. Zooming out to 3–6 months shows you seasonal trends. Zooming in to the last 4 weeks helps you react to what's happening right now.